
“Maybe life is random, but I doubt it.”
–Steven Tyler
There’s a news radio station in Fort Worth that has almost all of its daytime weekend programming related to money, investing, and personal finance. It’s almost like the programming folks at CNBC decided to take over this radio station on the weekend, because, unless the Texas Longhorns are playing, you can tune in to this station and listen to money advice to your heart’s content.
I imagine that if someone listens to those shows long enough, he’ll become convinced that he knows more than the average Joe and can go into the markets and actively trade and make a mint.
Unfortunately, this would likely result in a sad ending for the listener, as 64% of individual stocks underperform the Russell 3000 index in their lifetimes.
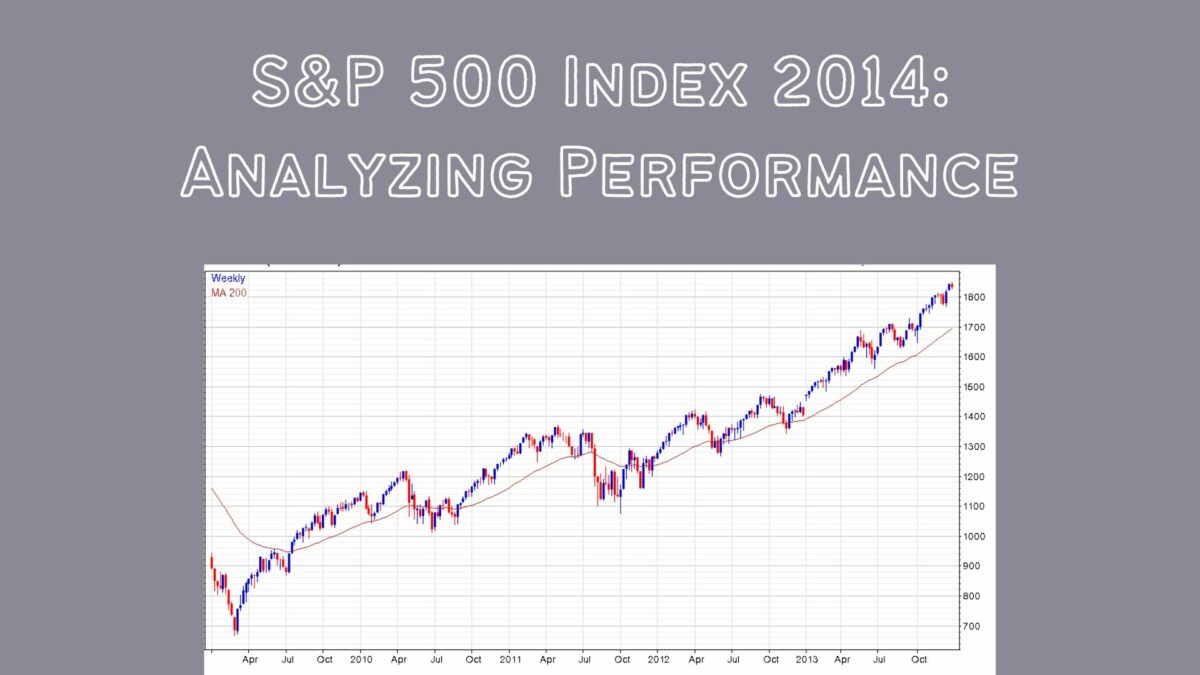
Last year, I evaluated how well the S&P 500 index did compared to randomly picking a stock out of the components that make up the index. In 2013, 51.6% of the components of the S&P 500 underperformed the index as a whole, leaving individual stock pickers with thinner wallets than their index investing counterparts.
But, just like fans of all sports teams except the champion, there’s a rallying cry: “Wait until next year!”
So, 2014 has now come and gone. The S&P 500 performed pretty well, but not as well as 2013, gaining a dividend adjusted 13.69%, compared to 2013’s extraordinary 29.6% gain.
Since 2014 wasn’t as good for the S&P 500, does that mean that it was a stock picker’s market rather than an indexer’s market?
2014 Performance of the S&P 500’s Stock Components by the Numbers
To compare the performance of the components, I took the 486 stocks which remained in the index throughout all of 2014, eliminating either new entrants or spinoffs. I then looked at the opening prices on January 2, 2014 and the closing prices on December 31, 2014 to see how well each stock performed over the past year. If the dividend reinvested performance was better than the 13.69% average, then it was a winner. If not, it was a loser.
In total, 240 stocks outperformed the average, or 49.38% of the components exceeded the 13.7% gain in 2014 – the best in the 3 years I’ve been evaluating.
If you picked a winning stock, you probably got a return between 10% and 50%, and even if you picked a “losing” stock, you likely still turned in a gain, as 120 out of the 486 stocks stocks showed a loss on the year.
17 stocks lost more than 30%, while 4 stocks gained more than 90%.
Let’s look at the David Letterman Top 10 and the Bob Uecker Bottom 10 stocks for 2014.
The top 10 S&P 500 stocks for 2014
| Ticker | Change |
| LUV | 124.51% |
| EA | 105.31% |
| EW | 93.94% |
| AGN | 91.95% |
| DAL | 80.45% |
| KR | 63.55% |
| MU | 61.49% |
| VRTX | 60.39% |
| MNST | 59.62% |
| MAR | 59.15% |
The bottom 10 S&P 500 stocks for 2014
| Ticker | Change |
| FCX | -38.02% |
| GNW | -45.05% |
| AVP | -45.50% |
| ESV | -47.58% |
| DNR | -50.15% |
| NE | -55.35% |
| DISCA | -61.81% |
| RIG | -62.87% |
| APH | -69.68% |
| TMK | -80.25% |
This is the first year in three that I’ve been doing this analysis where you had about even odds, statistically speaking, of making a lucky throw of the dart. Of course, your trained dart-throwing monkeys might not always pick the right stocks, as Paula Pant explains in her experiment.
Throw a dart, though, for 6 years with a 49.38% chance of hitting a winner each year, and you’ll have a 1.45% chance of being a winner all six years.
Furthermore, as is usually the case, it was a few stocks that really pulled up the index. If you had your trained monkey throwing a dart at the dartboard and you picked a winner, then you outperformed the index, on average, by 15.96%; however, if that monkey picked a loser, then you underperformed the index by an average of 17.10%. So, while on average, you had a better shot at picking a winner compared to the index, the magnitude of your error if you didn’t train your dart throwing monkey well was greater.
Those aren’t odds I like.
Still tempted to invest in individual stocks? Let’s talk about it in the comments below!
Massive hat tip to Brian Remson for pointing out the methodology error in Yahoo Finance’s dividend-adjusted closing prices for the S&P 500. His research meant that the monkey lost again this year, as, using Yahoo’s numbers, 52.88% of stocks would have beaten the index. Dividend reinvestment is important to your investment performance!
Author Profile
- John Davis is a nationally recognized expert on credit reporting, credit scoring, and identity theft. He has written four books about his expertise in the field and has been featured extensively in numerous media outlets such as The Wall Street Journal, The Washington Post, CNN, CBS News, CNBC, Fox Business, and many more. With over 20 years of experience helping consumers understand their credit and identity protection rights, John is passionate about empowering people to take control of their finances. He works with financial institutions to develop consumer-friendly policies that promote financial literacy and responsible borrowing habits.
Latest entries
 Low Income GrantsSeptember 25, 2023How to Get a Free Government Phone: A Step-by-Step Guide
 Low Income GrantsSeptember 25, 2023Dental Charities That Help With Dental Costs
 Low Income GrantsSeptember 25, 2023Low-Cost Hearing Aids for Seniors: A Comprehensive Guide
 Low Income GrantsSeptember 25, 2023Second Chance Apartments that Accept Evictions: A Comprehensive Guide